Ice melt and motion measurements on south Greenland glaciers

Last year, FORLOH funded the installation of climate monitoring equipment in Greenland. Together with Greenland Guidance, ice melt and motion trackers were placed at three distinctly different glacier sites in south Greenland. Now, after having collected more than a year’s worth of data, the region is starting to reveal its characteristics. Comparing these new measurements to those taken 40 years ago tells us something about the impact of climate change.

See the original blog post on the FORLOH website.

Why doing science in Greenland is important

Greenland is located in the far north where temperatures are increasing faster than anywhere else on our planet. The world’s largest island is of particular interest because of its enormous, three kilometer thick ice sheet. If melted, the ice sheet would raise global sea levels by nearly three floors of a building, causing trillions of dollars worth of trouble for coastal areas across the globe. As mentioned in a previous blog post, the warmer it gets, the more the ice sheet mass loss becomes an unstoppable, runaway process. And this is just one of the facets of climate change. Scientists warn politicians that we are heading towards a brick wall and should push the brakes instead of easing off the throttle.

Reason enough to assess the state of the Greenland ice sheet by taking detailed measurements. That’s why FORLOH started investing in climate science in 2021. We selected the southern part of the Greenland ice sheet as our study area. Here, because conditions down south are a bit warmer, we can see how the rest of the ice sheet will fare in a future warmer climate.

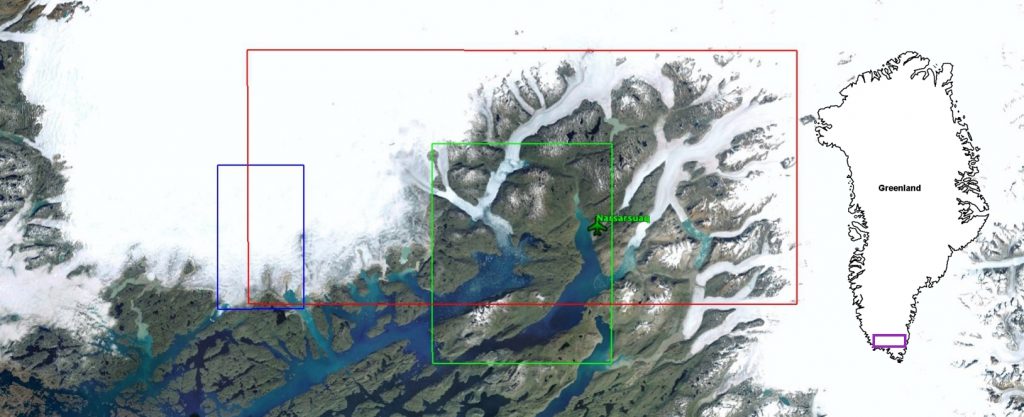
Google map showing the locations of the FORLOH-sponsored glacier monitoring sites in Greenland. Zoom in to take a closer look.

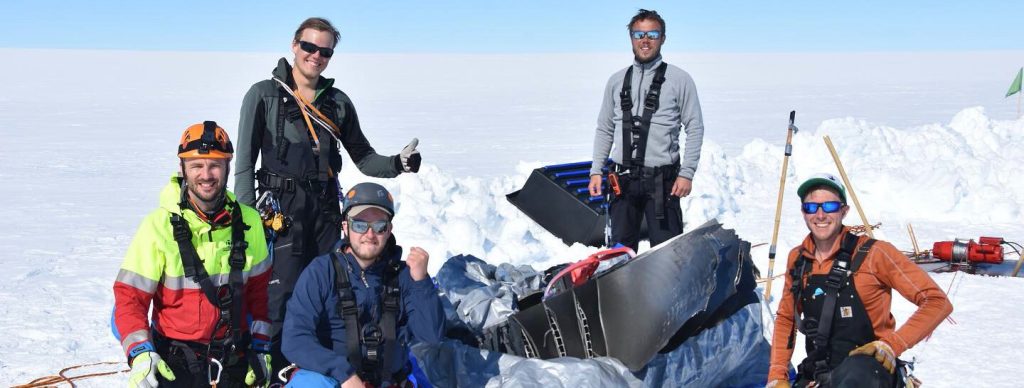
Rugged instruments in extreme climate conditions

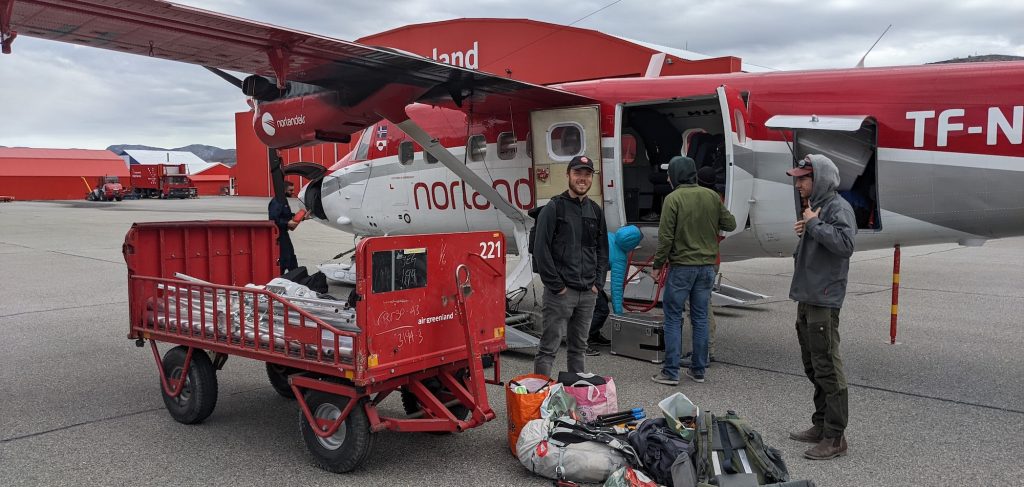
Last year, towards the end of the short Greenland summer, we installed three custom-built draw wire ice ablation trackers (DWIATs). Such instruments are used to study the two most important mass loss processes for the Greenland ice sheet: how fast the ice melts, and how fast the ice flows to the sea. Anything installed on an ice sheet, or on glaciers, moves with the ice as it melts downward when temperatures are above-freezing, and as it slowly flows downslope. This “moving with the glacier” is precisely what we take advantage of in our monitoring techniques.

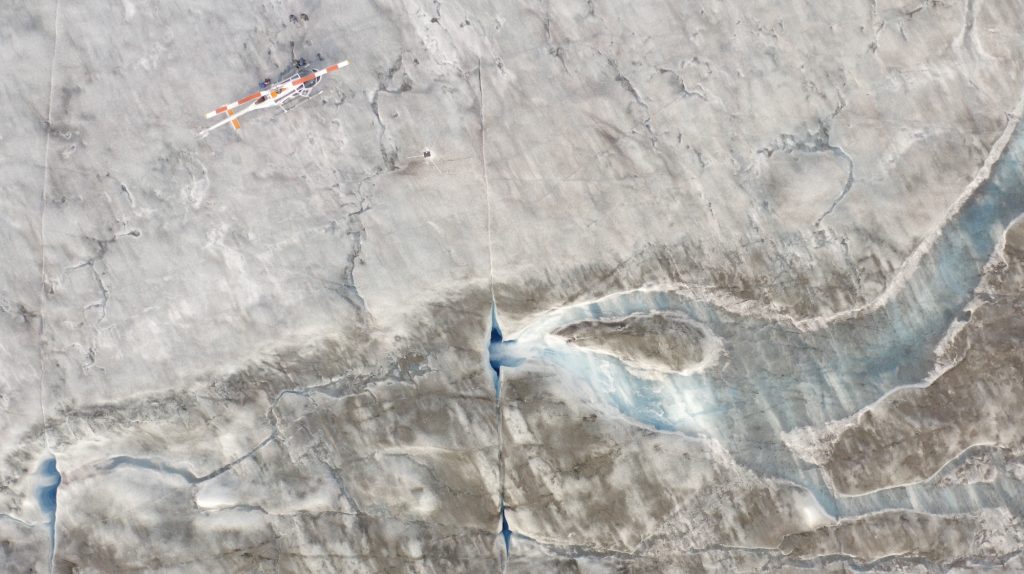
We chose three sites with very different characteristics to be able to study the whole range of climate impacts. Site 1 is on a slow-moving part of the main ice sheet, right next to a moulin – a meltwater drainage hole running straight through the ice sheet. Site 2 is on the fast-flowing valley glacier, named Eqalorutsit Kangilliit Sermiat; this glacier ends in a fjord where it produces icebergs, making it dynamically a different glacier than land-terminating ones. Site 3 is on a much slower, lake-terminating glacier named Nordbogletsjer, and provides historical context as the site was also monitored four decades ago.

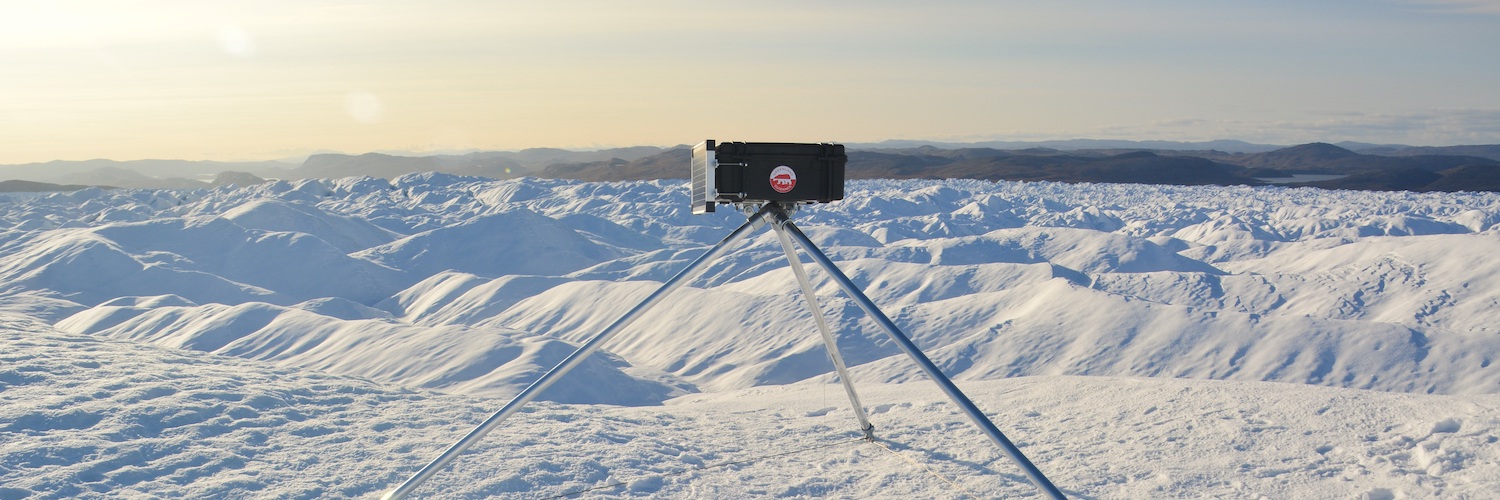
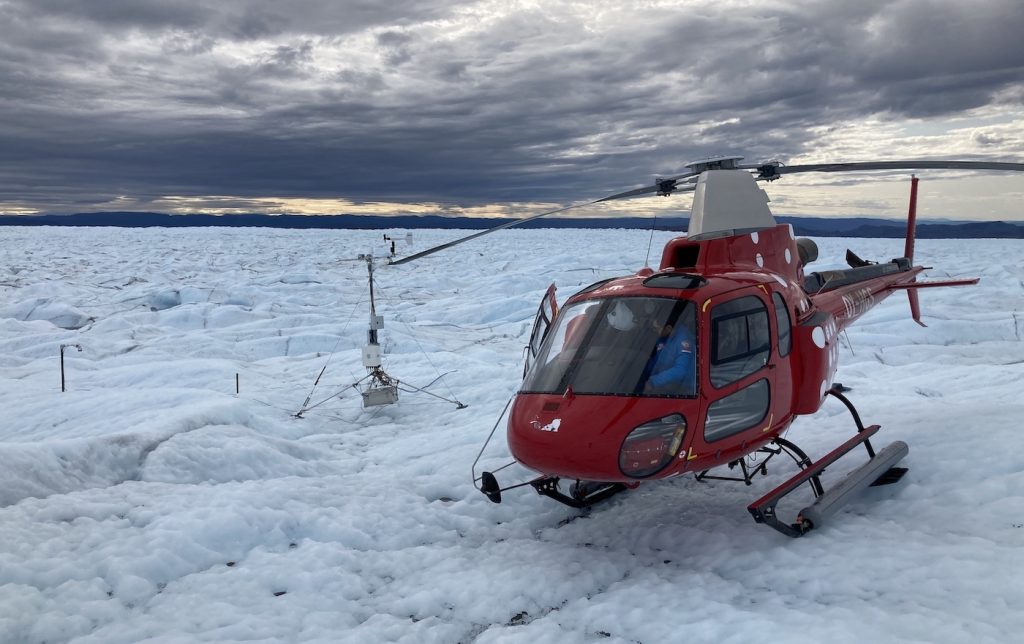
A draw wire ice ablation tracker, measuring glacier melt and motion. A wire running down from the instrument box is drilled into the glacier; as the ice surface melts down, the wire coils up in the box, so that the onboard computer can record how much ice has melted.

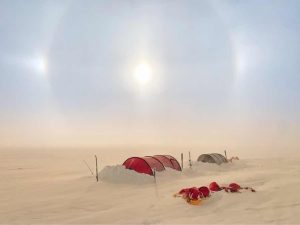
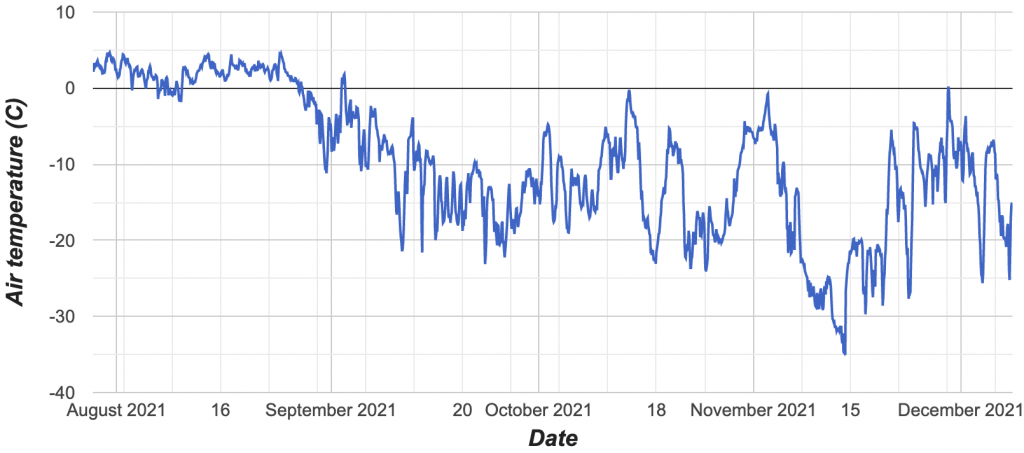
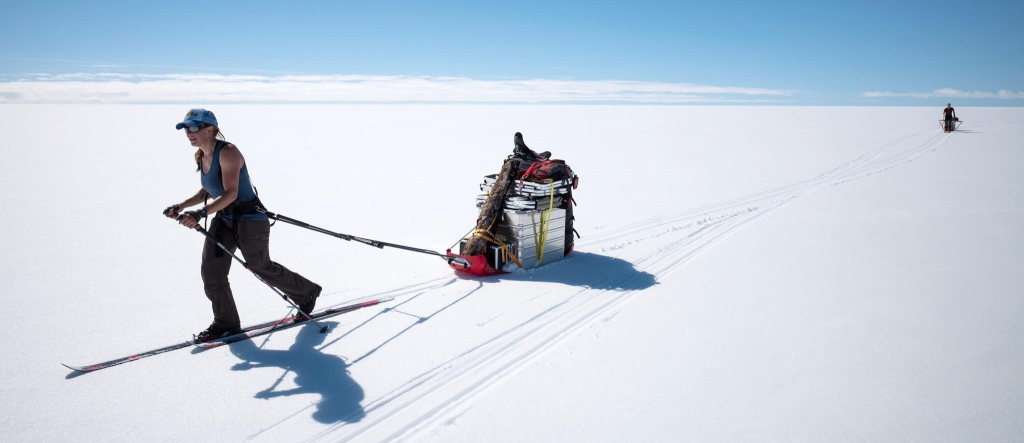
One thing these three sites have in common is that climate conditions are tough. Temperatures drop far below freezing in winter. Storms are among the fiercest on the planet. Drifting snow in winter bombards the instruments with static electricity. And a thick layer of winter snow exerts huge pressure on anything buried in it, as it compresses and melts in spring. That’s why we use extremely rugged instruments that are custom-built to survive anything the polar climate can throw at them.

Because the instruments also transmit their measurements via satellite link, we can study their data even before returning to the sites for maintenance. So let’s have a look at what the ice sheet has been up to over the past year.

Slides and caterpillars

The instruments measure ice motion using GPS. The glaciers flow from high to low elevations year-round, as gravity urges the ice down to the fjords. After more than a year of measuring, we now have a good idea of the average velocity at the three measurement spots. At “slow” site 1, the ice moves with an average velocity of 49 meters per year. At site 2, much more ice is transported judging from the average velocity of 1113 meters per year, over 20 times faster. The ice at site 3 moves 97 meters per year.

The horizontal velocity at which the ice moves at the three measurement sites. Note the difference in scales between sites 1 and 3 (left axis), and site 2 (right axis).

Big dynamic differences between the sites can also be seen in the annual cycles. The above graph shows that the ice at site 2, and to a lesser extent at site 3, has increasing velocities between autumn and spring – the period without significant melting. This has to do with mass building up as ice is constantly being supplied from higher regions of the ice sheet. Then, at the start of the melt season (in May), the ice suddenly accelerates. This occurs when meltwater runs straight down through cracks in the ice, making the glacier bed wet and slippery, causing the glaciers to slide more quickly. Once the glaciers have adapted to this by creating subglacial channels, efficiently draining the meltwater to the fjord, they regain their footing and the velocity drops during summer – in spite of large amounts of meltwater running through the system!

Site 1 does not experience a clear seasonality in ice velocity, indicating that the ice “conveyor belt” works differently here. Instead, a clear (roughly) three-week periodicity in speed exists at site 1, which can also be identified at both other sites. Velocity peaks at the three sites often occur at the same time, in spite of the tens of kilometers/miles separating them. This type of variability is often due to weather, with rain or melt events presenting the glacier bed with more water than it can handle, causing enhanced sliding and motion for a few days. But this is not all. The ice sheet has also been shown to move like a caterpillar, with velocity “waves” moving through the system. This can also explain part of the variability seen in the velocity graph.

The change in altitude of the three instruments since their installation in 2021.

To add to the picture, the above graph shows the change in instrument altitude. Fast site 2 is seemingly the most straightforward to interpret; here the ice flowed downhill by over a kilometer, losing 46 m of elevation in the process. But the other two sites show a more complicated story. During winter they actually gain altitude, as ice is supplied from higher regions, piling up the ice in its path. This local mass gain is then compensated during summer, when melting happens. At site 1, the two processes of ice dynamics and melting combined resulted in net thinning of the ice sheet by up to two meters in the past year, which fits the trend of what is seen around the ice sheet in the current climate. But remarkably, at site 3 we see a net thickening of about two meters. This is likely because more ice is flowing into the area than before due to an acceleration of the glacier on which site 2 is located, which feeds Nordbo glacier of site 3. As we’ll see below, it’s not because the ice is melting less these years.

Ice melt larger than 40 years ago

The instruments keep track of ice melt by measuring the length of a draw wire drilled into the ice. When the ice melts, the instrument tripod melts down with it and the wire coils up in the sensor. Even though a lot of snow falls in winter, and melts again in spring, this doesn’t contribute to the net surface mass balance – the mass lost over a year. The melting of the bare ice underneath started in June. With the melt season having come to an end in early October, we can assess that at the first site 3.98 meters (1.5 floors) of ice melted, at the second site 2.37 meters, and at the third 2.75 meters. The fact that site 1 melts fastest is partially due to it being at lower elevation where conditions are warmer (670 meters above sea level, versus about 800 and 880 meters at sites 2 and 3).

The amount of ice melted in 2022 at the three sites.

Up to four meters is a lot of ice, but it is impossible to know whether this is a “big” or “small” melt year without comparing it to other years. Not coincidentally site 3 was chosen for instrumentation. Here, researcher Poul Clement measured the surface mass balance on behalf of the Geological Survey of Greenland between 1977 and 1983. Various old data reports tell us that in 2022 melt at site 3 was about 24% larger than the average for 1977-1983. Even though 2022 was not a particularly warm year in the current climate. So a melt year that is “average” at best in present-day climate conditions, still exhibits considerably more melt than 40 years ago when “normal” was cooler.

The complexity of it all

The below graph shows how it all fits together at site 3; ice velocity, thickness and melt all interact. You’ll see two things that you couldn’t tell clearly from the previous graphs. The first is that the altitude drop that starts in early summer is largely due to melting. This makes sense: ice flow transports the ice into the area, and melting removes an approximately equal amount of mass. If it didn’t, the system wouldn’t be in balance, generally speaking.

The data collected at site 3 combined in a single graph. Note the different Y-axis for the yellow lines on the right-hand side.

The second thing to notice about the graph is that the high-frequent changes in ice velocity and thickness correlate pretty well. But ice thickness seems to be leading on most occasions: first the ice thickens/thins, and then, as a result, the ice starts moving faster/slower.

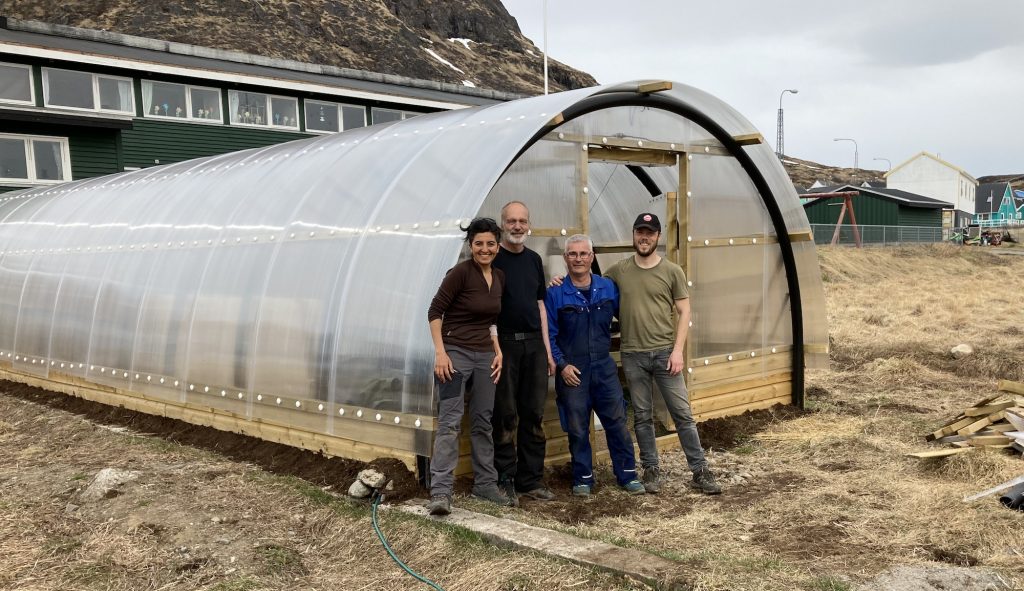
In hard-to-reach places, collaboration is key

We think it is imperative that scientific data are collected for the good of everyone. That’s why our data is open-access, available to anyone across the globe. You are more than welcome to have a look at the data here. If you’re a scientist (or student or teacher or just someone with an interest in glacier data), we can send you a batch of raw or processed data for you to use in your research. We’ll also upload the data to the servers of the Programme for Monitoring of the Greenland Ice Sheet (PROMICE) where scientists can download all sorts of important glaciological data and use them for generations to come.

The open-access nature of science becomes even more relevant in remote places, where transportation (by helicopter) is expensive and opportunities for visiting hard-to-reach field sites are few. Therefore we are excited that the large Swiss Green Fjord project chose the same region to study, resulting in data exchange and logistical collaboration. Likewise, the Geological Survey of Denmark and Greenland, already active in the region for decades, chose FORLOH site 2 to install a phase-sensitive radio echo sounder – a radar system for studying processes at the glacier bedrock, putting our data to good use.

Looking forward

So the data have given us some first insights into the workings of the ice sheet and the interaction with the climate. Data is flowing towards climate scientists and whoever else shares the passion. This will help with better interpretation of satellite imagery in ice sheet studies, and with more precise computer models predicting the future state of the ice sheet. The more measurements we take, the more we contribute to climate science, especially in a remote and special place like Greenland. Because only few such measurements exist.

But perhaps the most relevant will be to see how ice melt and motion will change in the coming years, to get a good understanding of interannual variability, and to keep a finger on the pulse of the shrinking ice sheet. It won’t be long before we’ll be able to use simple computer modeling to estimate future melt in different atmospheric warming scenarios. Then we’ll know better how much this large ice-covered region can contribute to sea level rise. And as a scientific community we’ll have more evidence to share with policy makers, so that they can take action to further combat climate change.

Why the spring peak in Greenland field activities?

Field activities in Greenland are often confined to spring and summer. In autumn and winter, low temperatures, snowfall, the lack of sunlight, and more frequent storms do not provide optimal working conditions. Besides, the most interesting processes to study primarily occur in the warm season, such as the melting of the glaciers and ice sheet.

There are two distinct peaks in Greenland field activities. The first is in spring, for those people who need to get out there when things are still frozen, but when daylight and weather conditions are workable. The second peak is in mid-to-late summer, when weather conditions are best, melting is strongest, and the ice sheet margin and tundra is snow-free and more accessible. In between there is a potentially less pleasant period with often soggy conditions, and billions of mosquitoes. With the summer peak getting underway, let’s see what the spring rush is all about.

Installing instruments before the warm season

A good reason to get over to Greenland in spring is when you want your instruments in place to monitor what’s happening during the “warm” season, when plants grow, animals reproduce, and glaciers melt. Or, in the case of the University of Fribourg, when meltwater is generated at the top of the snowpack on the ice sheet. The Swiss scientists have now returned several times to the same sites in the lower accumulation area. They study how much meltwater gets refrozen in the cold snow underneath the surface, how much runs off into the ocean, and how this will change in time. Greenland Guidance provided weather forecasts for them to optimize their activities and prepare camp for storms, if needed. This spring their field team had two weeks on ice with surprisingly good weather conditions.

The University of Liverpool placing a weather station next to a fast-moving glacier (photo: James Lea).

Another team out there this spring was the University of Liverpool, who where installing GG-built instruments at a fast-flowing glacier in southwest Greenland. They are investigating a glacier that has retreated a lot in the past few years. When such a glacier experiences melt, an already complex system becomes even more complicated, for instance because of large pulses of meltwater originating from ice-dammed lakes along the sides. Or from rain events. With their instruments up and running in mid-May, they timed it well.

In May and June, the Geological Survey of Denmark and Greenland (GEUS) visited GC-Net weather stations high on the ice sheet. This is part of their annual maintenance efforts that take place in spring to make sure all systems are up and running during summer. We were invited along to help out. Each station takes several hours to service, but the more people can help, the faster the Twin Otter airplane can return to town. The machine experienced engine trouble, but luckily this happened at the airport before departure, and not on or over the ice sheet.

Preparing for takeoff to do maintenance at GEUS GC-Net sites (photo: Ken Mankoff).

Snow conditions

A second reason for the GC-Net maintenance to take place when it is a bit colder has to do with snow conditions. The scientists need to dig deep snow pits to asses the mass of the snow that fell since the last site visit, and this is done best before seasonal melting happens.

For others a cold snow layer means increased safety. Ski traversers crossing the ice sheet have to pass crevasse fields, and this is done much more safely if there is a solid snow bridge on top, deposited during winter. When snow gets wet because of melting, such bridges get weaker, and falling through them into a deep crevasse becomes a serious threat. That’s why the wind-powered kite-ski traverse team led by Bernice Notenboom did their expedition before the melt season, in May. They traveled an astonishing distance of nearly 2000 km from ice sheet base Dye-2 to the northwestern town of Qaanaaq. During their expedition they were confronted with several storms that we warned them about via satellite transmission.

The Winds of Change kite-ski camp

Preparations for summer

Often spring activities are mere preparations for summer expeditions. Take for instance the greenhouse in Narsaq in south Greenland. In order for charitable organization Greenland Trees to be able to plant trees along south Greenland fjords at the end of summer, their new greenhouse had to be prepared for growing seeds and cuttings in April and May. It took a lot of effort, but is was truly nice to notice how happy locals are with the project, and how eager they are to collaborate – including schools.

The Greenland Trees greenhouse in Narsaq.

In terms of volume, most of our clients and collaborators are scientists or camera crews, asking where to rent a boat, how to get permits, which locals to interview, and how to get to a remote site. But we also provided support to Swedish company SKB, who have been running and funding science projects in the Kangerlussuaq region over the past 15 years. In preparation of a groundwater sampling campaign to occur at their unique bedrock borehole in late summer, we went ahead and inspected the state of their equipment, inventoried their storage, and downloaded data collected by sensors deep underground.

The SKB bedrock borehole at the ice sheet margin.

With SKB discontinuing their Greenland science projects as of 2022, Greenland Guidance was selected to take over their surface hydrology project situated in the Two Boat Lake catchment. This is an exciting opportunity, and we welcome suggestions for scientific collaboration by anyone who reads this. More about the TBL project in an upcoming blog post!

Two Boat Lake with the ice sheet in the background.

Busy times

For Greenland Guidance, spring is the busiest time of year. This is when we support field parties remotely, take part in fieldwork ourselves, prepare for fieldwork in summer, and custom-build instruments for summer deployment. Nowadays we are also building and refurbishing instruments for use in the Himalayas for Utrecht University and the Indian Institute of Technology Roorkee. And we’ve expanded our area of expertise by now also focussing on ocean sciences through collaboration with MetOcean in Canada, and our new instrument platform Polar Monitoring.

Climate science enabled by Forloh

The glaciers in south Greenland are the canaries in the coal mine. They are located in the warmest part of Greenland. As the climate warms, glaciers further north will experience similar conditions in the future. So to learn about the future fate of the Greenland ice sheet, we must study how south Greenland glaciers fare in present-day climate conditions. For this reason we installed 3 draw wire ablation trackers (DWIATs) in south Greenland, and more instruments will follow. An important difference with most other science projects is that this project got funded by a pioneering, US-based company named Forloh.

Forloh site 1 as seen from above. The DWIAT instrument is located between helicopter and moulin (meltwater drainage hole).

For Greenland Guidance it all started when we were approached by Greenland logistics guru Kathy Young who was in touch with a company eager to contribute to climate science. A company appropriately selling warm outdoor clothing. Forloh was seeking to sponsor climate science in a cost-effective manner. With Greenland Guidance’s non-profit approach to science, a match was soon in the making.

Our missions with the instruments in south Greenland is not only that the observational data are shared freely with researchers across the globe, but also that the measurement locations are optimal for scientists. For this reason we asked the research community where they could see most value in having DWIATs monitor ice melt and motion. After this we decided on 3 sites requiring only short helicopter flights in south Greenland.

Winter temperatures – an example of Forloh scientific data displayed in the GG data portal. DWIATs also measure surface melt, latitude, longitude, altitude along with several system-diagnostics parameters. Note how DWIAT 1 got covered by winter snow accumulation judging from a reduced temperature variability on the right-hand side of the graph. But satellite transmissions keep coming in.

One monitoring site is right next to a moulin (meltwater drainage hole) on the main ice sheet. The second instrument is on the large, fast-flowing glacier named Eqalorutsit Kangilliit Sermiat (often called Qajuuttap Sermia) which is receiving increasing amounts of scientific attention these days. The third is on Nordbo glacier (Nordbogletsjer), a historic site where ice melt was also measured over 4 decades ago, providing an excellent opportunity to study the impacts of climate change since then.

Kathy Young and Steve Munsell, GG support crew along with Armin Dachauer, on Eqalorutsit Kangilliit Sermiat (also called Qajuuttap glacier) after installing a DWIAT.

Our helicopter charter took place on a Thursday in August. We were spared any weather delays, which are not uncommon when flying in Greenland. Our first site took some scouting as we had about 20 moulin candidate sites selected from satellite imagery. The second and third site were know before arrival, chosen to avoid crevasses and to match the historic measurement location, respectively. Instrument assembly/testing and drilling the draw wire into the glacier took 30-45 minutes per site. Even though the drilling at these wet sites proved difficult, we managed to stay on schedule, leaving some time for collecting footage at the spectacular moulin site.

We very much invite other scientists to collaborate scientifically or logistically in this project. Please do get in touch if you’re active in the region and have specific data needs.

The Forloh study area in south Greenland in red. The blue area contains GEUS PROMICE instrumentation. The red area is where Greenland Trees is active. Eqalorutsit Kangilliit Sermiat is the large glacier in the middle.

Sky Detectives – a BEA documentary featuring Greenland Guidance

Recently the "Sky Detectives" documentary aired on French television showcasing the high level of expertise by the French bureau for investigating civil aviation safety, the BEA. Central to the storyline is a project the BEA coordinated in Greenland, in which Greenland Guidance played its part.

On 30 September 2017 a large Airbus A380 airplane lost parts of its number 4 engine, which were scattered over the Greenland ice sheet. Luckily nobody got hurt. An investigation into the cause of the accident was started immediately, but the critical engine piece needed for the investigation, the fan hub, was nowhere to be found in the area searched by helicopters. A new expedition could not be launched until the next spring due to the onset of cold and dark Greenland winter. So in spring 2018 an airborne radar team and a ground radar team combed the 15 km2 search area to find … nothing.

Director Louis-Pascal Couvelaire interviewing GEUS researcher Liam Colgan for “Sky Detectives”.

The search for the (now two-part) fan hub proved extremely difficult because the heavy titanium had impacted into the snow surface. It got covered by increasing amounts of winter snow as time progressed, rendering visual detection impossible. Also the radar systems initially proved impractical as subsurface ice layers, of which there are many in this part of Greenland, could be mistaken for engine pieces.

Having improved their processing techniques of the airborne radar data, by 2019 Onera, the French aerospace lab, had identified a few potential targets for the ground team to inspect. And shortly after, on the last day of an expedition suffering from several storm delays, a team led by researcher Ken Mankoff of the Geological Survey of Denmark and Greenland (GEUS) detected a metal object at 3-4 meters below the surface. Right between two large, potentially dangerous, snow-covered crevasses.

Dirk van As on behalf of Greenland Guidance and GEUS in “Sky Detectives”.

The final expedition to the ice sheet took place in June 2019. A team of 5 including 3 Greenland Guidance mountaineers flew to the dig site armed with shovels and lots of safety equipment. The much desired fan hub fragment was extracted on 30 June.

Central to the investigation was the BEA, the French bureau for investigating civil aviation safety. They got all partners together and working towards retrieving the missing fan hub pieces. Recently, Elephant Productions finished a documentary on the BEA in which the Greenland project gets ample attention. The documentary was made for TV channel France 5, and its French title is Les détectives du ciel. It’s a 87 minute documentary that features Greenland Guidance quite prominently!

A shorter, English version called “Sky Detectives” will be broadcasted internationally. Keep an eye on our @GreenlandGdnc Twitter feed to find out where you can see it.

“Under Ice”, a documentary focussing on the final fan hub recovery expedition, by Arnar Ingi Gunnarsson / Gale Force North.

Revisiting ice monitoring equipment along the K-transect

Last summer, Greenland Guidance was again invited to assist with instrument maintenance on the western slope of the Greenland ice sheet. Here, along the iconic K-transect, Danish and Dutch scientist have been using automated measurement systems to monitor climate variables and surface ice melt for decades. As these weather stations, ice ablation trackers and other scientific measurement systems are exposed to harsh weather such as low temperatures, high wind speeds and countless thaw/freeze cycles, they need to be looked after once a year.

The PROMICE weather station at GEUS monitoring site KAN_L.

As in previous years, the Geological Survey of Denmark and Greenland (GEUS), the Institute for Marine and Atmospheric Research Utrecht (IMAU) and Greenland Guidance joined forces to visit all 10 measurement sites. Unlike the year before, the weather was reasonably well behaved; clouds and winds did not interfere too much with helicopter operations. In the higher ranges of our work area though we encountered a thick layer of saturated snow. Uncommonly warm air masses were over the ice sheet causing a serious melt event, severely complicating moving about in the soft, wet snow.

A draw wire ice ablation tracker one year after deployment.

Most equipment was found in good working order, requiring between 15 minutes and 3 hours of ground time per measurement site. The good news for Greenland Guidance was that all 4 custom-built draw wire ice ablation trackers (DWIATs) were fully functional and transmitting ice melt and motion data home.

A moulin fountain, spraying ice sheet meltwater 10 m up into the air.

One of the highlights of the 5-day fieldwork campaign was the sighting of what is best described as a “moulin fountain”. This rarely seen phenomenon occurs when overpressure from a large moulin (meltwater drainage hole in ice) is released via a crack in the ice to a smaller, neighbouring moulin.

Weather forecasts for Swiss scientists on the Greenland ice sheet

Greenland Guidance provided detailed weather forecasting for a Swiss science expedition on the Greenland ice sheet in spring this year. The expedition by the University of Fribourg took three weeks during which they camped in tents at 1700 m above sea level.

Weather is the largest safety hazard to expeditions at the camp’s position in southwest Greenland. Even in spring, temperatures can be dangerously low at -35 C, storms can damage tents, and whiteout conditions can make people lose camp even at 10 m distance. Also other dangers exist, yet it is unlikely to encounter dangerous crevasses or wildlife in this region; crevasses usually form where ice is thinner, closer to the ice sheet margin, whereas polar bears are spotted more frequently where their food sources live – on sea ice and at the coast.

Luckily the Swiss expedition did not encounter overly hazardous weather conditions on this occasion. Our weather forecasts helped them plan their days away from the safety of camp. Each morning at breakfast time they received an Iridium satellite text message containing up to 160 characters worth of weather information for their location and finetuned to their activities. Upon request, or if the situation required it, more weather messages would follow.

Later in the year, during an exceptional heat wave in summer, we passed over the region where the Swiss had camped. The surface of the area had turned into slush (snow saturated with meltwater), with a multitude streams where usually only snow can be seen. Good news for Swiss research on meltwater in snow. Less good news for those having to recover equipment temporarily stored on the ice sheet, now possibly stuck in refrozen meltwater…

Helicopter view of extreme melting at 1750 m elevation on the Greenland ice sheet 19 August 2021

Instrumenting Jakobshavn ice stream

Jakobshavn ice stream in Greenland is the most productive glacier in the world. In July of this year the University of Zürich (UZH) in Switzerland installed four Greenland Guidance instruments at Jakobshavn. Two glacier weather stations and two ice motion trackers measure ice movement via GPS in a detailed study of glacier dynamics.

GWS at Jakobshavn with Adrien Wehrlé (UZH)

Since their installation these instruments have been sending home the data they collected via the Iridium satellite network. The data feed into our data portal where it can be viewed and download by the university.

Because the instruments are positioned on Jakobshavn’s fast moving ice, the trackers are recording high ice velocities. And in only four months time they measured an elevation drop of about 25 m as the ice sheet flows towards the ocean.

Although winter hasn’t entirely arrived yet, the uppermost weather station at 1100 m above sea level already measured temperatures down to -35 °C. We are eager to find out whether temperatures down to -50 °C will be recorded come January, February or March. The lowest temperature measured by our instruments further south is “only” -43 °C.

High-elevation weather station maintenance on the Greenland ice sheet

This June, Greenland Guidance joined the annual maintenance of weather stations high up on the Greenland ice sheet. One major difference with instrument maintenance closer to the ice sheet margin is that equipment in the interior of the ice sheet gradually gets buried by snow. In the higher parts melt is rare, and more snow accumulates in a year than that it melts. At low elevations summer melting is abundant, ablating winter snow and several meters of the underlying ice. Ice dynamics take care of the ice mass transfer from high to low elevations – otherwise the ice sheet would get taller and steeper each year.

A downside to working in the accumulation area is that one needs to shovel snow pits of 3 m deep to retrieve buried equipment, which is particularly challenging given the thin air at 2-3 km above sea level. Also travel distances are larger between the science site and the airport where you start the day, meaning that there is a larger chance of running into adverse weather delaying the operation. On the other hand the work can be done by a fixed-wing aircraft equipped with skis, as opposed to the helicopters required to land in low-elevation, uneven, or even crevassed terrain. These airplanes don’t worry as much about weather conditions as helicopters do. And they can carry a lot of equipment.

GEUS GC-Net maintenance by Twin Otter

Not hampered by cloudy or windy conditions, we visited five measurement sites of the Greenland Climate Network (GC-Net) by Kenn Borek Air Twin Otter in six days. This year is the first year that GC-Net maintenance is done by the Geological Survey of Denmark and Greenland (GEUS). The network recently changed hands. The GC-Net got established by the Cooperative Institute for Research in Environmental Sciences (CIRES) in Boulder (US) in the 1990s and has since delivered large amounts of important climate data, contributing to many scientific studies and climate reports. Professor Konrad Steffen was a central person in all this, pushing the benefit of these measurements to climate science to great heights.

Breaking Boundaries: The Science of Our Planet

Greenland is, unfortunately, an excellent place to show the impact of climate change. Temperatures are increasing relatively rapidly, and the consequences are visible all around the ice sheet as outlet glaciers accelerate, thin and retreat. Entire ecosystems change, forcing the local community to change traditions and customs – for instance in fishing and hunting. Greenland is only the proverbial tip of the iceberg, as nature is in flux around the planet.

Last year Greenland Guidance supported a film crew shooting footage for a Netflix documentary. Breaking Boundaries: The Science of Our Planet came out recently and features very impressive footage of the Greenland ice sheet (and elsewhere), narrated by David Attenborough. Go see it if you haven’t already!

Polar Monitoring: the website for rugged instruments

Greenland Guidance entered into a collaboration with MetOcean. From now on we offer polar instruments by both companies via the common portal PolarMonitoring.eu! It’s the perfect match: MetOcean produces instruments for in the ocean, on sea ice and on land, whereas Greenland Guidance instruments are made for use on glacier ice and land. Together we have full polar coverage!

The Stokes Drifter is a compact drifting buoy that provides real-time surface current data.

Please do visit PolarMonitoring.eu, have a look around, and tell your friends and colleagues. You won’t find these instrument cheaper anywhere on the European market, especially considering the decades of experience that have gone into making them extremely durable and easy to use.

The Greenland Guidance data portal

Our instruments measure whichever climate variable or glacier characteristic you’d like them to measure. They are built to survive extreme winds, temperatures far below freezing, long periods of darkness, burial by snow, and countless freeze/thaw cycles. Yet they measure with accuracy, draw little power, and are easy to transport. But in the end it’s all about the data. Getting those is of primary importance.

Example graph showing temperature data from the Greenland ice sheet.

All measured data are kept safe in the GG instrument’s data logger, awaiting the return of the instrument owner some time in the following years. But often it is beneficial to receive some or all data right away via satellite link. Our instruments feed their data straight into our data portal, where instrument owners can view and download their transmitted data. Every client gets a free, password-protected webpage where data are plotted in a clear and simple manner, and where transmitted data can be downloaded at the click of a button.

The DWIAT, measuring ice melt and ice motion.

Draw wire ice ablation trackers: measuring ice melt and motion

Several months ago we installed 4 new draw wire ice ablation trackers (DWIATs) on the Greenland ice sheet on behalf of the Geological Survey of Denmark and Greenland (GEUS) and the Institute for Marine and Atmospheric research Utrecht (IMAU). The DWIATs monitor surface lowering by melting, movement as a result of ice dynamics, and temperature (inside the sensor box). Melt and motion are interlinked, as more melt leads to greater amounts of water at the glacier bed, which can result in increased glacier motion. The accuracy of localisation by GNSS satellites is accurate, allowing for the identification of periodical speed-up events. The DWIATs can be further tailored to your needs by adding additional sensors.

DWIAT installation (photo Maurice van Tiggelen)

DWIATs are very rugged, and easy to install: 1) Assemble the tripod with hex keys. 2) Mount the sensor/logger box. 3) Drill a hole max. 14 m deep. 4) Lower the draw wire into the hole. 5) Switch on the system. The units’ batteries can be shipped without dangerous goods declaration, and allow solar charging at temperatures (well) below freezing. Even without recharging during dark winter months the trackers keep functioning for several months. Both software and hardware safeties are built into Greenland Guidance instruments; double measures to prevent battery discharge beyond critically low levels.

The units recently installed in Greenland transmit their data through the Iridium satellite network that has coverage at even the northern- and southernmost latitudes. The data feed straight into the Greenland Guidance data portal where they are displayed and made available for download on a private web page. If the instrument owners approve, the data can also be graphically displayed on (but not downloaded from) the public data portal. Naturally, the DWIATs also store their measurements locally in the datalogger, ready for read-out during the next field visit in one or several years.

The DWIAT data currently featured in our public data portal belong to GEUS who monitor the Greenland ice sheet mass balance in the PROMICE project.

Borehole under ice: instrument maintenance and science support

About a decade ago a consortium of scientific and commercial organisations led by SKB in Sweden drilled a borehole in the bedrock underneath the Greenland ice sheet. Their goal: to quantify the level of interaction between the ice sheet and the groundwater below. To achieve this they drilled a 651 m long borehole angled underneath the ice sheet and equipped it with instruments. It is the first ever borehole drilled underneath an ice sheet – a truly unique project.

The location of the borehole underneath the ice sheet

Recently, SKB asked Greenland Guidance to perform instrument maintenance to ensure the continuation of the time series during a period when travel to Greenland is complicated by the COVID-19 pandemic. We gratefully accepted the task. While on site, we saw an opportunity to also shoot some drone footage.

The measurements taken in the borehole form a long, uninterrupted, and scientifically surprising time series. With the help of scientists from the University of Montana and others, SKB has written up a manuscript that is currently under review in a scientific journal. Greenland Guidance helped with the interpretation of the borehole data in terms of ice melt and movement, and is proud collaborator on the study.

Ice sheet weather station maintenance along the iconic K-transect

This year we took part in a scientific expedition to the southwestern region of the Greenland ice sheet. Representing the Geological Survey of Denmark and Greenland (GEUS), and in collaboration with the Institute for Marine and Atmospheric Research (IMAU), we serviced instruments and stakes placed at 10 different sites on the ice sheet. We accessed the remote sites, up to 140 km into the ice sheet, by Air Greenland helicopter.

GAP/PROMICE weather station KAN_U in 1 m of snow

The scientific instruments by GEUS and IMAU monitor the interaction between the atmosphere and the ice sheet. In other words, they determine how much ice melts, and what is causing the melt: which combination of warm weather, solar radiation, strong winds, etc. The GEUS instruments are part of the measurement networks of the Greenland Analogue Project (GAP) and the Programme for Monitoring of the Greenland Ice Sheet (PROMICE). We even installed 4 of our own draw-wire ice ablation trackers (DWIATs) – more about that in an upcoming news item.

The measurements are taken along the iconic K-transect, where ice sheet monitoring already began in 1990(!). The longer the times series, the more valuable it gets. Long climate records provide much needed context for measurements in individual years: if there is 5 m of ice melt – is it a lot (above average) or not?

Even though taking measurements over many years is crucial for climate science, it is not always an attractive option for funding agencies. So if you’d like to financially support the monitoring activities along the K-transect, it could make a large difference!

Sign up to become a 2021 Greenland Guidance field specialist

We are always on the lookout for people with specific skill sets that can help us during future field campaigns. Do you have field experience in Greenland or other remote regions? If you’d like to join us during the 2021 field season (NH spring/summer), then tell us you’re available here: https://greenlandguidance.com/about-us/join-us/. If you’re on the list, we’ll know how to find you.

The team recovering an Airbus A380 engine fan hub from crevassed terrain. Picture by Austin Lines (Polar Research Equipment).

University of Lausanne sediment coring in a Greenland fjord

This september, a team of scientists from the University of Lausanne set out to collect sediment cores from the bottom of the fjord into which the glacier named Eqip Sermia calves icebergs. They contacted Greenland Guidance to help them find a boat with a winch that could lift the sediment cores from the bottom of the 200-m deep fjord to the surface. Finding a boat was easy, but finding a winch that would get the job done was more of a challenge. Especially in times of COVID-19 with life in Greenland coming to a standstill. But we managed to track one down so that the expedition could take place.

The scientists reported that “The expedition went great! We collect 35 sediment cores and things went well with the boat. It was a ton of work and a bit icy on the water by the end. It really went as good as we could have expected.”

Scientist processing a sediment core just winched onto the deck

Weather forecasting for a Swiss science expedition

This summer Greenland Guidance initiated a new service: expedition weather forecasting. Especially important for expeditions taking place in remote regions where internet access is virtually impossible. Three scientists from the University of Fribourg camped on the ice sheet while investigating meltwater in snow. We sent them detailed weather forecasts that they received on their Iridium satellite phone each morning before breakfast. We included reports on longterm stability and/or storms approaching so they could plan their activities accordingly.

Swiss scientists moving camp (Picture: Horst Machguth)

The forecasts turned out particularly relevant when the team was trying to charter a helicopter for their departure, but cloud fields were causing frequent white-out conditions during which helicopters can’t fly. At an earlier date we warned them for heavy snowfall and strong winds for their location, which is extremely rare in July.

Heavy snow accumulation during the team’s expedition recorded by a nearby PROMICE weather station. 15 cm is a lot of snow for this location in summer!

Upon safe return, we received useful feedback from the field party, allowing us to finetune our Iridium messaging forecast service. The team was pleased with the accuracy of the forecasts and reported “they were very valuable and helpful!”

Documentary on the recovery of the airplane engine part

Here’s a very nice 30-minute documentary by talented Arnar Ingi Gunnarsson on the 2019 recovery of the Airbus engine part lost over the Greenland ice sheet. Greenland Guidance was part of the challenging fan hub recovery after a long and difficult search by GEUSONERA – The French Aerospace LabAarhus University and Polar Research Equipment. Recently BEA (Bureau d’Enquêtes et d’Analyses pour la sécurité de l’aviation civile) finished their investigation looking into the causes of the accident – with some interesting findings (check out their website). Greenland Guidance thanks AirbusAir France and Engine Alliance for the excellent collaboration.

University of Liège studies the wind power potential of Greenland

That’s the gist of it. And to be able to do so, three masts measuring wind and temperature were installed in the south Greenland fjord area by the University of Liège over the summer. These masts are ten meters tall – ten meters being the standard level for wind measurements. But in order to survive the fierce winter storms in the region, each mast had to be very sturdy, bolted into rock, and equipped with guy wires. Setting up such heavy masts is easier said than done.

Greenland Guidance helped out with various aspects in the early phases or the project, most importantly to obtain permits (site allocation), but not with the installation itself. For the installation the University of Liège’s team received help from the Northabout crew – the ship is sailing the northern waters for the Unu Mondo expedition to increase the visibility of the impact of climate change on the northern regions and its people. We’ve had the pleasure of staying on board their vessel and are keen to help them find scientific institutions to partner with in coming years.

The weather masts are in place and transmitting their data. Please check out the website of the Katabata Project for more information.

Greenland ice sheet monitoring at the K-transect

Greenland Guidance has several links to the iconic K-transect, where scientists have been measuring ice sheet surface mass balance for an astonishing 30 years. Not only are we building scientific instruments to be placed along the transect, we also have a history of performing maintenance on the existing infrastructure on behalf of the Institute for Marine and Atmospheric Research in Utrecht (IMAU) and the Geological Survey of Denmark and Greenland (GEUS).

The transect, consisting of 10 instrumented sites, is located along the western slope of the Greenland ice sheet, from the low-elevation ice sheet margin, up to an elevation of 1840 m above sea level. Both surface mass balance and weather/radiation observations are made, to be able to quantify ice loss, and to explain which processes (such as atmospheric warming) dominate this mass transfer from the ice sheet to the oceans.

The end of an era might be approaching as obtaining funding for the monitoring is becoming increasingly difficult. Even though the measurement time series is becoming more important with each added year – in Greenland there is nothing that compares. And even though many important scientific publications have relied on these data in the past.

That’s why SKB, the primary funder of GEUS’s efforts at the K-transect for the past 13 years, requested Greenland Guidance to construct a video with the aim to make more people aware of the climate and ice sheet science being done in Greenland, and to attract additional funding.

Support the monitoring efforts at the K-transect on the Greenland ice sheet

If you’d like to support climate science through this project, then do not hesitate to get in touch -> see the video for contact information. Or get in touch with us, and we’ll guide you to the appropriate people.

Support in development of drill to melt through Greenland ice sheet

Greenland Guidance provided insights in choosing the most durable parts for a drill being developed by the Geological Survey of Denmark and Greenland (GEUS). It’s tricky business as the melt-tip drill will generate high temperatures while melting its way through cold glacier ice. The drill development is for the HOTROD project headed by Liam Colgan, whereas Chris Shields is the project’s CTO. We were excited to be able to contribute to this project by choosing parts and shipping them over to GEUS. We’d love to see the drill in action in the field, either in 2020 or 2021.

Scientific publication about Airbus engine recovery from Greenland

Following our project of recovering a part from an Airbus A380 airplane engine from the Greenland ice sheet last year, we wrote a paper detailing our methods. The part was crucial for determining what went wrong on that flight over Greenland in 2017. Read the paper by Ken Mankoff and coauthors in the Journal of Glaciology here: http://dx.doi.org/10.1017/jog.2020.26.

Abstract:

On 30 September 2017, an Air France Airbus A380-800 suffered a failure of its fourth engine while over Greenland. This failure resulted in the loss of the engine fan hub, fan blades and surrounding structure. An initial search recovered 30 pieces of light debris, but the primary part of interest, a ~220 kg titanium fan hub, was not recovered because it had a different fall trajectory than the light debris, impacted into the ice-sheet’s snow surface, and was quickly covered by drifting snow. Here we describe the methods used for the detection of the fan hub and details of the field campaigns. The search area included two crevasse fields of at least 50 snow-covered crevasses 1 to ~30 m wide with similar snow bridge thicknesses. After 21 months and six campaigns, using airborne synthetic aperture radar, ground-penetrating radar, transient electromagnetics and an autonomous vehicle to survey the crevasse fields, the fan hub was found within ~1 m of a crevasse at a depth of ~3.3 to 4 m and was excavated with shovels, chain saws, an electric winch, sleds and a gasoline heater, by workers using fall-arrest systems.

Planting trees in Greenland

In August/September this year we supported the Greenland Trees organisation in planting trees. We helped plant 5000 tree saplings in the town of Narsarsuaq, south Greenland, where trees are abundant today – for a Greenland location. As community engagement and youth education are important themes to Greenland Trees, we also traveled to Narsaq and Qaqortoq to meet the locals, and plant another few hundred trees. Next year, in Greenland Trees’ second year, we aim to return to help plant many more trees.

BBC revisits Greenland glacier and sees … change

A few weeks ago Greenland Guidance helped the BBC with their operations in Greenland. They spoke with locals, interviewed climate scientists including professor Jason Box, and documented a tree planting project. Their expedition resulted in stunning footage, showcased in several news segments about Greenland and climate change. We were very happy to support this BBC operation and once again see how they operate – with a high level of professionalism.

Check out some of their Greenland footage here: Climate change: Greenland’s ice faces melting ‘death sentence’.

Newspaper NRC travels to Greenland

This July, Dutch newspaper NRC visited Greenland to document climate-related changes in the ice sheet. We provided guidance on when to go where, who to talk to, and we took care of some of the logistics required to stay among scientists and visit the ice sheet.

Science editor Marcel aan de Brugh: “To put together my trip to Greenland, I got help from Greenland Guidance. They know the research community very well, and had different options for me to join researchers in the field. They also arranged some other things, like a stay at the Kangerlussuaq International Science Support. My 7 day trip to Ilulissat and Kangerlussuaq (and from there onto the ice sheet) was impressive and unforgettable.”

Read about some of their experience here (in Dutch): https://www.nrc.nl/nieuws/2019/09/04/glijden-op-het-smeltende-ijs-van-groenland-a3972156